What OEE tells you
OEE (Overall Equipment Effectiveness) answers one question: of the time a machine was planned to produce, how much did it actually produce good parts at the right speed? It combines three losses into one number:
- Availability loss: the machine was stopped: breakdowns, setups, waiting for material, no operator.
- Performance loss: the machine ran slower than the approved cycle time, or had small stops.
- Quality loss: parts were produced, but rejected or reworked.
An OEE of 60% means 40% of planned capacity was lost. The value is not the number itself. The value is knowing where it was lost, while you can still act.
Why Excel OEE does not work
Most plants calculate OEE from operator log sheets at the end of the day or week. Log sheets and machine counters rarely agree, short stops are never written down, and the reasons are remembered rather than recorded. The result is a number that is late, optimistic and impossible to act on.
Live OEE from machine data
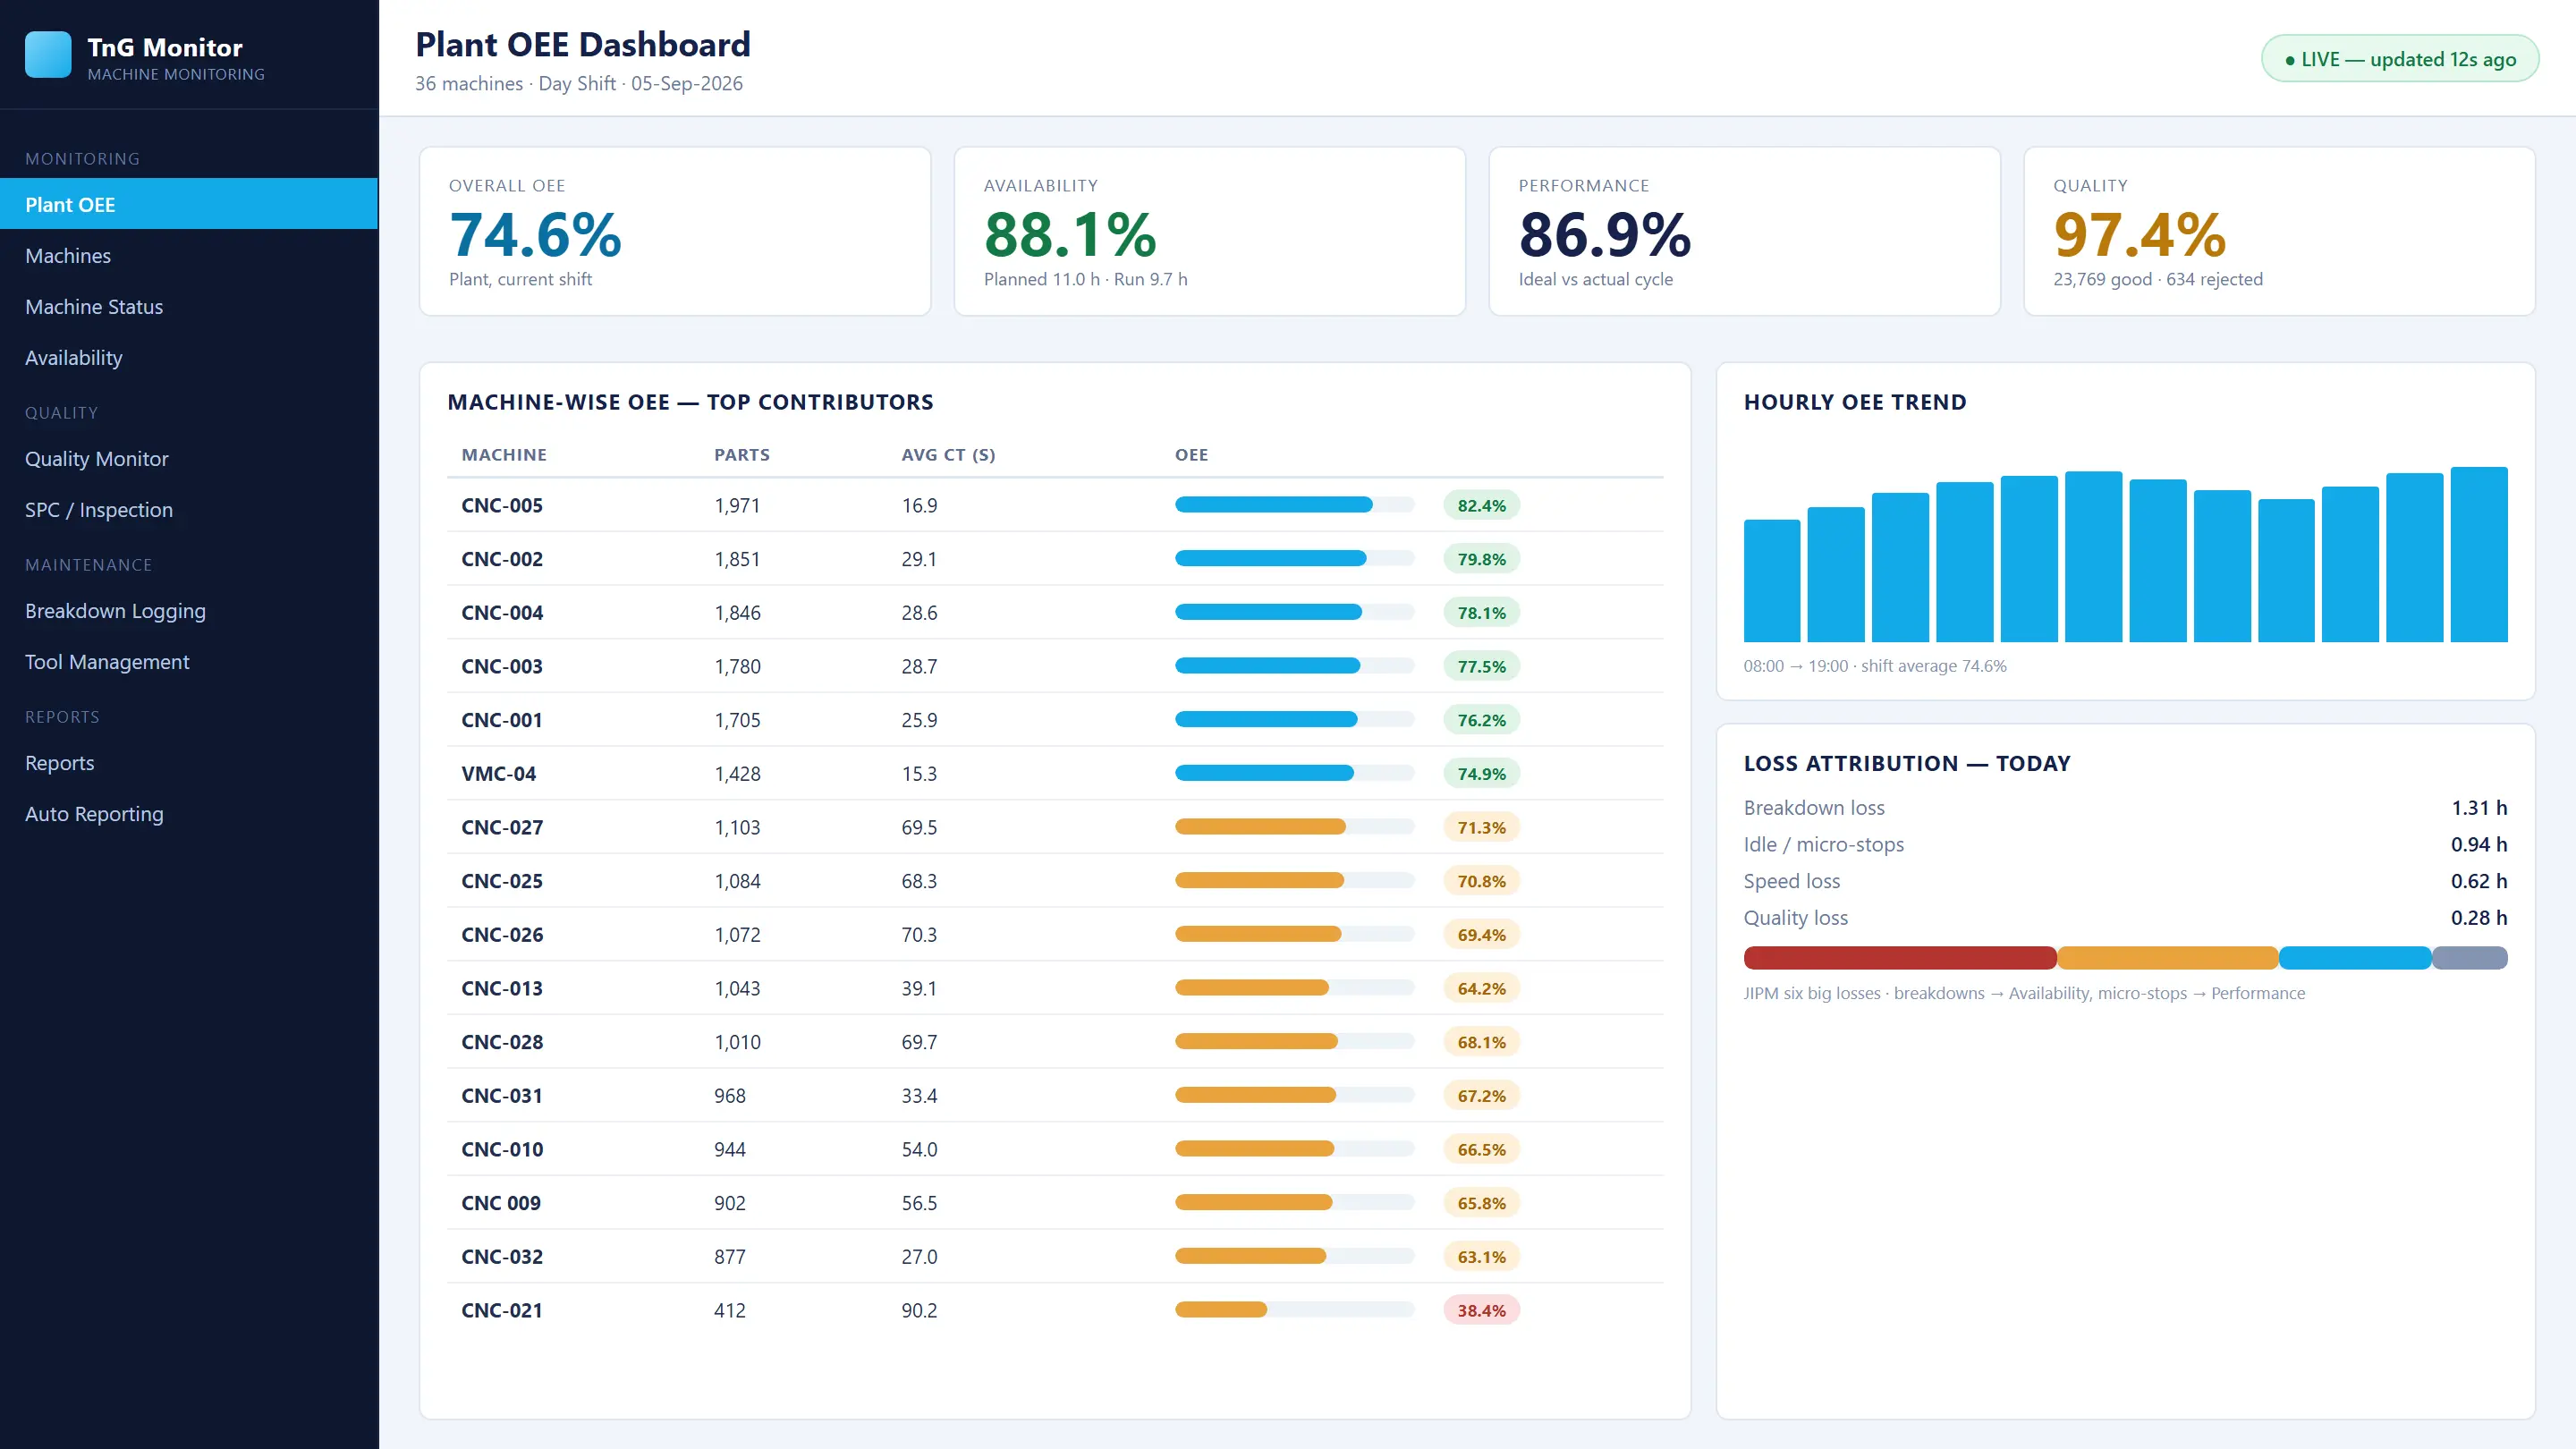
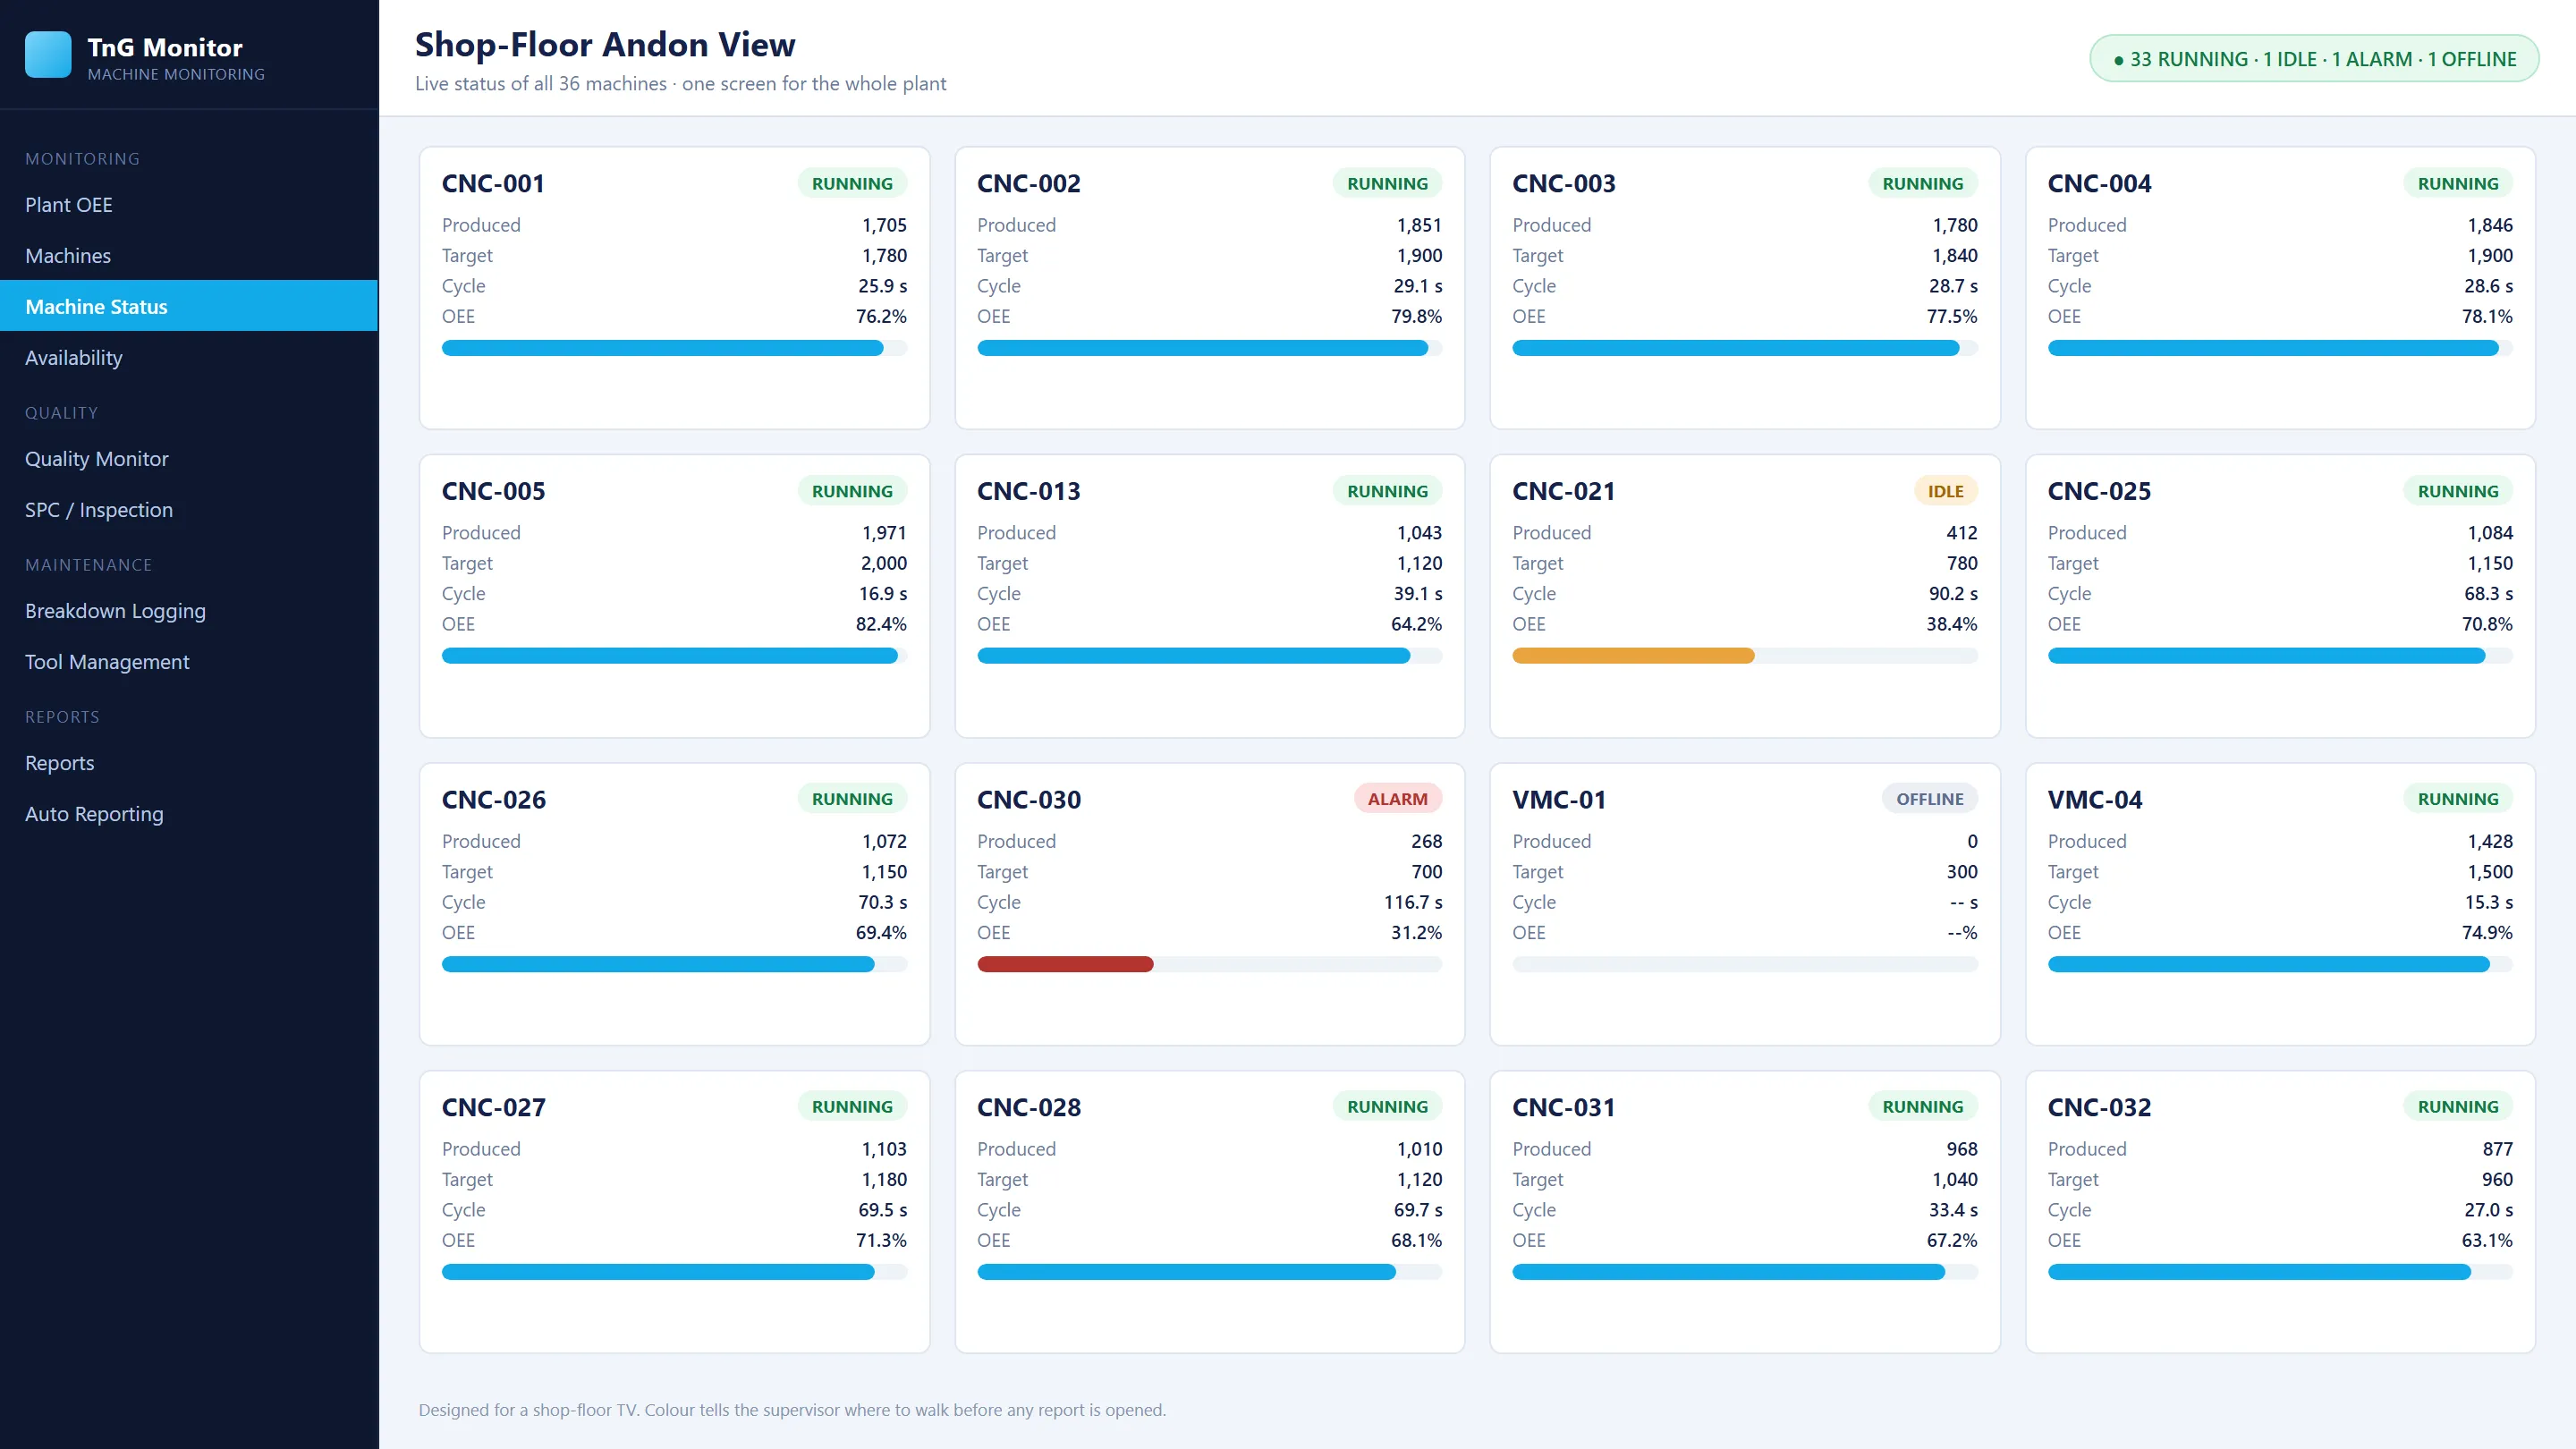
TnG Machine Monitoring reads machine status, production counts and cycle timing directly from the machine every 100 milliseconds. OEE is calculated continuously under your agreed shift settings, for every machine, line and the whole plant.
- Availability comes from recorded running, idle, alarm and offline time. Offline time stays separately visible, so it is never mistaken for a breakdown.
- Performance compares current and average cycle time with the approved target for the running part, detected automatically from the part master.
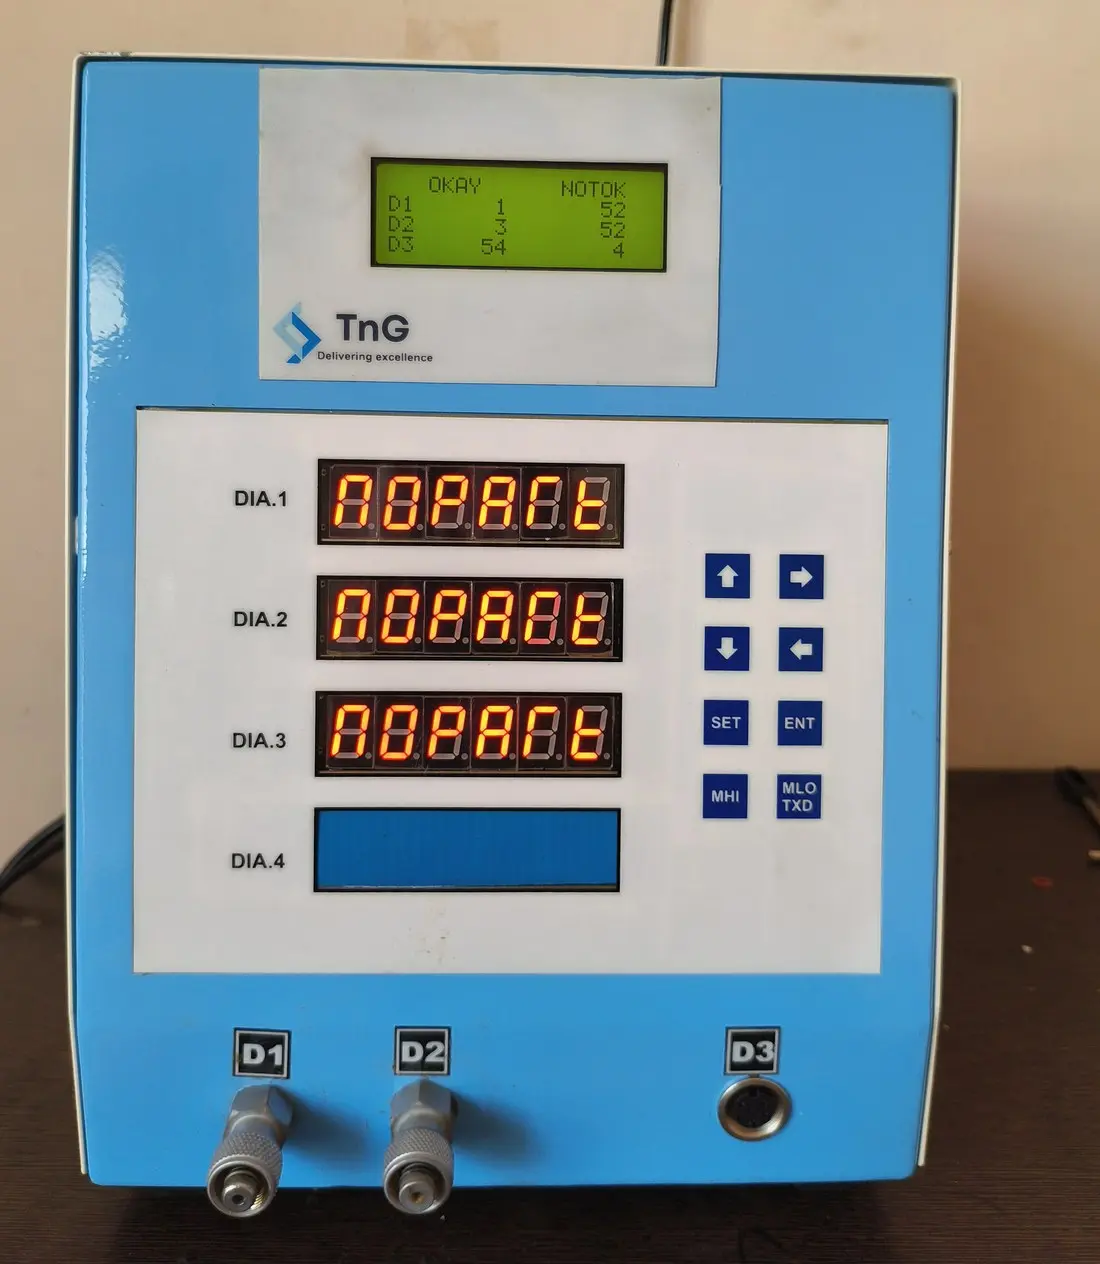
- Quality comes from rejection records and connected smart gauges, so the quality rate is measured, not estimated.
Turning OEE into action
A live number is only useful if it leads to action. TnG links every loss to its cause:
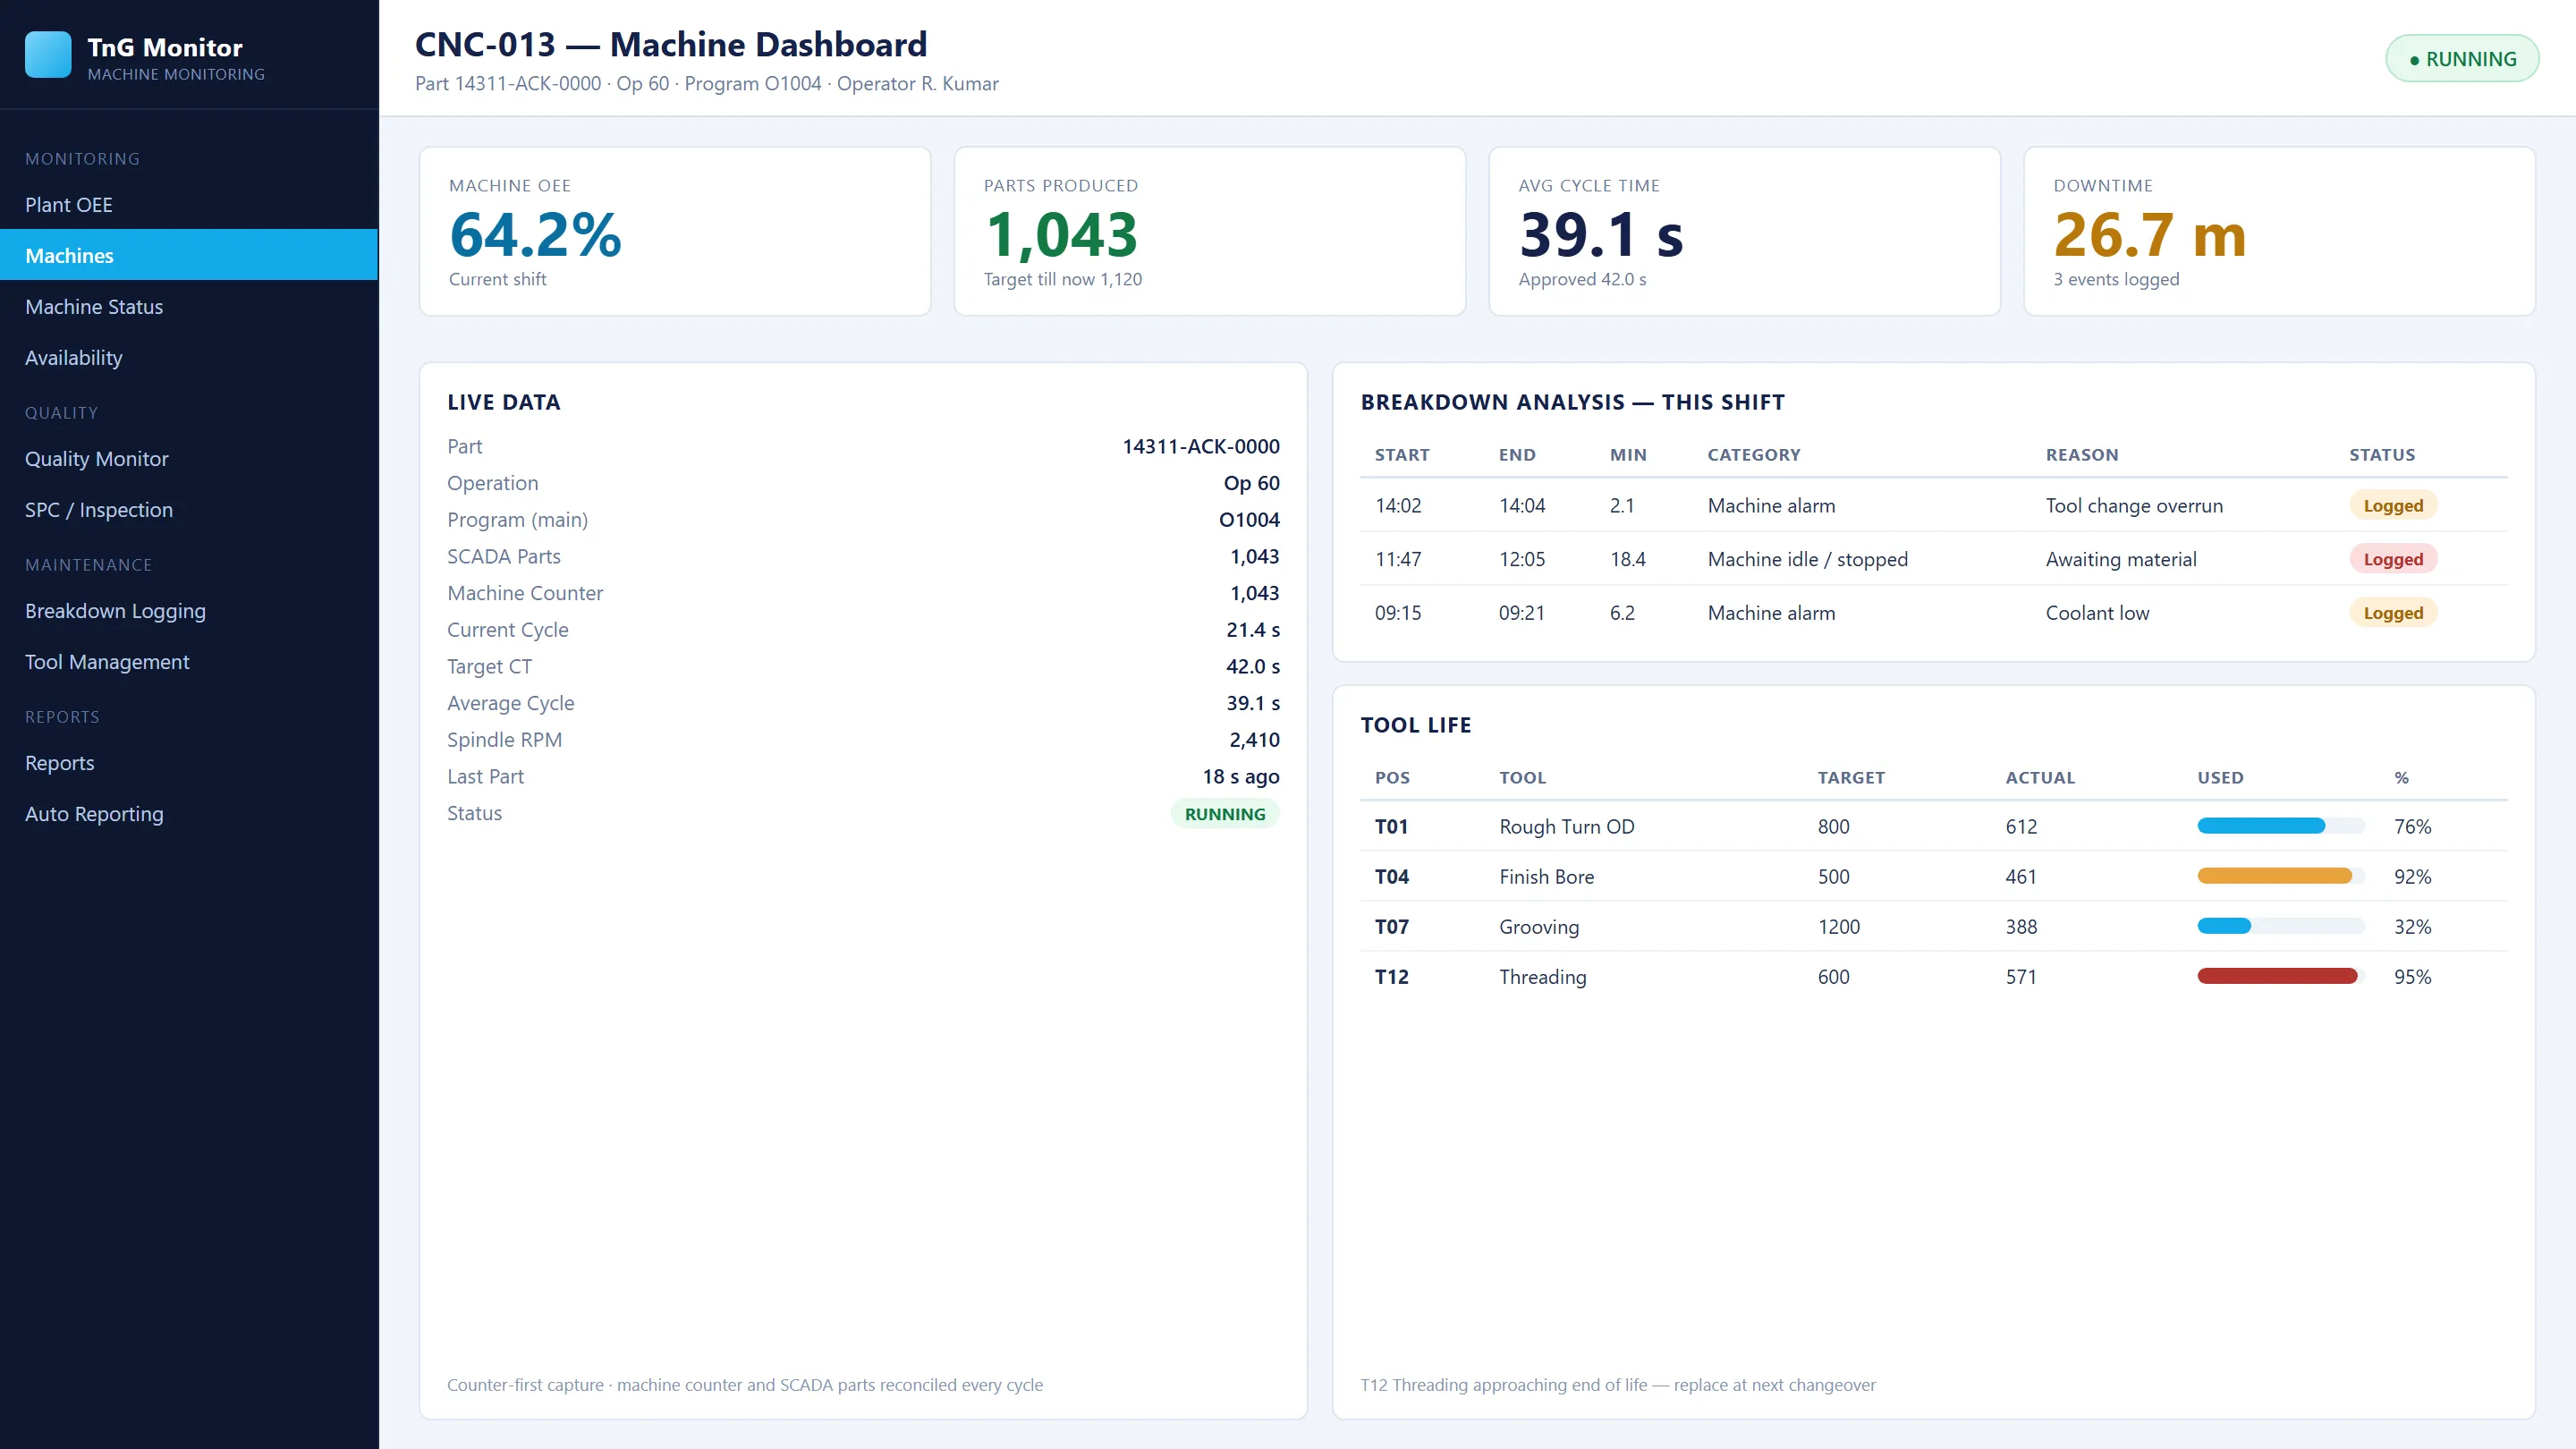
- Breakdowns with reasons. A stop beyond the agreed limit opens a breakdown record. The operator gives the category, the technician the detailed cause.
- Alerts to the responsible team. Each category routes to the right department on mobile, with acknowledgement recorded.
- Pareto of losses. Reason Pareto and machine-wise downtime show which few causes cost the most capacity.
- Target versus actual. Hour-by-hour production against target shows the shortfall before the shift ends.
Reports
OEE, availability, performance, quality, operator, part-wise and historical OEE summary reports. Filter by shift, date, machine and part, export to CSV or PDF, or schedule Excel and PDF reports by email to management.
Where to start
Start with a pilot on a few critical machines. Within the first weeks you will have an honest baseline OEE and a ranked list of losses. That is the starting point for every improvement after it.